PUBLISHED
IT’S GRIM
UP NORTH
Britain had changed. Someone wrote four words on a bridge.
There is something almost perfect about this photograph.
Not because the graffiti is clever.
Not because it is beautiful.
But because of where it was written, and when.
On a bridge over the northbound M1, just beyond the M25, somebody painted four enormous white words:
IT’S GRIM UP NORTH.
You could hardly choose a better location.
London.
Yorkshire.
Lancashire.
Merseyside.
The North East.
Above the motorway, almost like a warning erected at the frontier:
It’s grim up north.
The phrase was already becoming part of popular culture. The KLF released It’s Grim Up North commercially in 1991, turning the stereotype into something strange, industrial and deliberately confrontational.
But forget the record for a moment.
Look at the year.
Margaret Thatcher had left Downing Street less than a year earlier.
And Britain on the other side of the 1980s was a very different country from the one that had entered them.
THE DECLINE DIDN’T
START WITH THATCHER
It is tempting to begin this story in 1979.
That would be too easy.
Britain’s industrial problems were older than Thatcherism.
By the 1960s, the industries upon which huge parts of Britain had been built were already shedding workers.
And the numbers are extraordinary.
Between 1964 and 1969. Add agriculture and related industries and the decline across these traditional sectors reached roughly 678,000 jobs in five years.
So Britain knew.
This wasn’t something that suddenly appeared with Margaret Thatcher.
The old economy was changing.
Foreign competition was growing. Technology was replacing labour. The structure of international trade was changing.
The question wasn’t whether the old industrial economy would change.
The question was what Britain was going to build in its place.
WHILE BRITAIN
WAS LOOKING BACK
In 1945, Japan was devastated.
Two of its cities had been destroyed by atomic bombs. Much of the country’s urban and industrial infrastructure had suffered enormous wartime destruction.
Yet within two decades Japan was constructing something the world had never seen before.
The first Tokaido Shinkansen began operating.
The bullet train.
A new railway. New technology. A new piece of national infrastructure designed around what transport might become rather than what it had been.
1964.
A railway does not explain Japan’s post-war economic transformation, and Britain and Japan were not economically or institutionally identical.
But it symbolises something.
ONE COUNTRY WAS ASKING
WHAT CAME NEXT.
Britain possessed enormous inherited industrial wealth and infrastructure, but was struggling with industries and systems created during an earlier economic age.
And we knew they were declining.
We knew.
Successive British governments did attempt regional policy, industrial support and economic diversification. Britain was not literally doing nothing.
But decade after decade the same problem remained.
Britain never found one convincing answer.
THE TOWNS THAT
MADE THINGS
Because deindustrialisation is far too clean a word.
It sounds like something happening on a spreadsheet.
These industries existed somewhere.
They belonged to places.
These weren’t little heritage workshops.
These industries organised entire towns.
A steelworks wasn’t simply a building containing jobs.
A shipyard supported another network.
A pit supported another.
The wages went into pubs, shops, football grounds, markets and high streets. Bus routes followed workers. Housing grew around factories. Generations of families acquired skills around them.
The industrial employer wasn’t merely somewhere you worked. It was part of the architecture of the town.
And then, in many places, it disappeared.
STEEL
Take Sheffield.
A decline of roughly 60 per cent in twelve years.
And again, the decline had begun before Thatcher.
In 1978, Parliament was already discussing import penetration in Sheffield special steels and the loss of around 1,500 jobs in only fifteen months.
But then came the early 1980s.
A parliamentary debate in 1981 estimated that more than 15,000 Sheffield steel jobs had disappeared during 1980 and 1981 alone across the public and private sectors.
Think about that.
Not over a generation.
Two years.
A city doesn’t simply absorb something like that and continue unchanged.
THE DOCKS
Liverpool tells another version of the story.
The docks were already losing labour long before 1979.
Containerisation, roll-on/roll-off shipping, palletisation and bulk handling transformed ports everywhere.
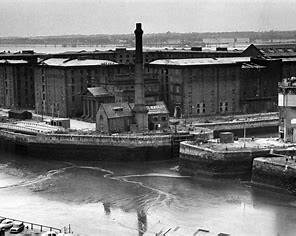
By 1985, Parliament was told that dock employment in Liverpool had fallen from 13,589 in 1965 to 2,086.
But the decline had spread far beyond the waterfront.
Approximately a quarter of the city’s employment disappeared during that decade. Manufacturing employment fell by nearly 40 per cent.
Again, the dock wasn’t simply the dock.
It was warehousing. Haulage. Engineering. Manufacturing. Shops. Services. Families. Streets.
A whole urban economy built around a port.
COAL
And then there was coal.
Here the scale becomes almost difficult to comprehend.
UK colliery wage-earners. By the year of the M1 photograph, roughly three quarters of the colliery jobs that remained in 1979 had disappeared.
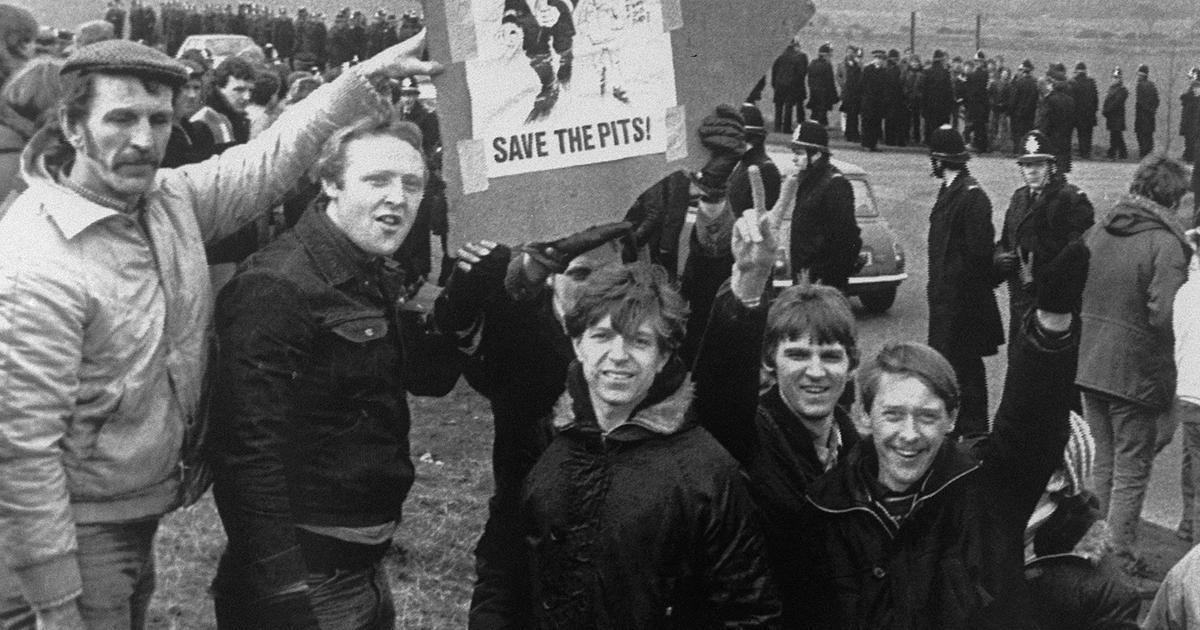
And the closures kept coming.
Government figures later recorded 27 larger deep-mine closures in 1985–86 alone, another 15 in 1986–87, 14 the following year, then 6, 11 and 9 in the three years through 1990–91.
These weren’t dots scattered randomly across Britain.
They were communities in which the pit had structured working life for generations.
The photograph above matters for that reason.
These were not simply workers defending a balance sheet. Families understood that when the pit disappeared, the consequences would reach far beyond the men who went underground.
Closing a workplace is one thing.
Replacing the reason a town exists is another.
SHIPS
Then consider Sunderland.
This wasn’t somewhere that happened to have a shipyard.
Sunderland was one of Britain’s great shipbuilding towns.
In December 1988, the government announced that the remaining North East Shipbuilders yards would progressively close after no bid was judged capable of providing a viable commercial future for them.
The government simultaneously announced an enterprise zone and other measures intended to create replacement employment.
That distinction matters.
There was an argument then, just as there is now, about whether keeping an uncompetitive industry alive indefinitely was economically sensible.
But there is another question.
WHAT HAPPENS TO
THE TOWN AFTERWARDS?
Closing an industry can happen remarkably quickly.
Building another economic ecosystem can take decades.
THEN CAME
THATCHERISM
This is where Margaret Thatcher belongs in the story.
Not at the beginning.
In the acceleration and the change of philosophy.
Her governments inherited industries already struggling with productivity, competition, technological change, industrial relations and, in some cases, enormous losses.
Supporters of the government’s approach argued that Britain could not indefinitely subsidise uneconomic production and that restructuring, competition and higher productivity were necessary.
Opponents argued that the speed of that restructuring, combined with changes to regional and industrial policy, imposed an extraordinary burden on particular communities.
That argument still hasn’t really ended.
But something measurable happened.
Manufacturing employment in the United Kingdom.
Not every one disappeared because of government policy.
And industries had been declining before Thatcher entered Downing Street.
But the economic transformation of the 1980s was enormous.
And geographically, it wasn’t neutral.
TWO
BRITAINS
By 1987, Parliament was openly arguing about a North–South divide.
Figures presented in the House of Lords also put average weekly household income in the South East at 41 per cent higher than in the North.
One statistic captures the desperation particularly well.
There is the transition in one number.
The new economy had arrived.
There simply wasn’t enough of it.
And that is perhaps the central mistake in the way we remember deindustrialisation.
We talk about the industries that disappeared.
We talk less about the gap between their disappearance and whatever came next.
BRITAIN DIDN’T STOP
MAKING THINGS
There is another complication.
Britain didn’t simply stop manufacturing.
Factories became more productive.
Technology reduced the amount of labour required to produce things.
Some industries survived and became highly sophisticated. Others were replaced by different forms of manufacturing.
So this isn’t a nostalgic argument that every coal mine, shipyard and textile mill should somehow have remained frozen in 1965.
That would be absurd.
Economies change.
Industries die.
Technology advances.
The failure is not necessarily allowing an old industry to disappear.
The question is whether you have thought seriously enough about what comes afterwards.
Because GDP can recover.
Productivity can improve.
The national unemployment rate can eventually fall.
But a town can still lose the economic institution around which it was built.
WHAT DISAPPEARS
WITH A JOB?
That is what statistics miss.
A pit closes.
A steelworks sheds 10,000 workers.
A shipyard disappears.
Economists record employment moving from one sector to another.
But people don’t live inside national accounts.
They live in places.
Those who can leave often do.
Those who remain grow older.
Buildings empty.
High streets weaken.
Property values stagnate.
And gradually the physical town begins recording the economic change.
INDUSTRIAL DECLINE
BECOMES SOCIAL DECLINE.
Eventually, the industry that built the place becomes a museum.
THE
BRIDGE
Which brings us back to the photograph.
And those four roughly painted words.
Nothing about this was designed to become a historical document.
But more than thirty years later, that is exactly what it looks like.
Because by 1991 the phrase contained something Britain had spent decades creating.
There really were enormous regional disparities.
There really were towns in which industries that had supported generations had disappeared.
There really were communities being asked to find an entirely new economic reason to exist.
But the phrase also contains something else.
Something slightly cruel.
IT’S GRIM UP NORTH.
Not:
Britain has failed to replace the economic foundations of many of its industrial communities.
Not:
Technological change and economic restructuring have fallen disproportionately on particular regions.
Not even:
There is a serious North–South divide.
Just:
Grim.
A huge part of the country reduced to a stereotype.
And that is why the location of the graffiti might be the most interesting thing about it.
IT WAS PAINTED
JUST OUTSIDE LONDON.
On the northbound M1.
For people leaving the South to see.
Almost like a border sign.